Summary
The new Pure1 application intelligence feature provides auto‑discovered app identification, file‑level analytics, actionable insights, and cross‑links into other Pure1 workflows. This gives storage admins visibility they haven’t had before and helps them save time.


For years, storage administrators have had excellent visibility into their infrastructure: IOPS, latency, capacity utilization, and data reduction ratios. However, if you ask a storage admin which of their volumes is running Oracle, or whether that MS SQL database is properly protected, you’ll often get a blank stare. That gap between storage and application context is exactly what Everpure™ Pure1® application Intelligence is designed to close.
The problem Everpure is solving
Enterprises run critical workloads on Everpure FlashArray™ every day. Oracle databases, MS SQL clusters, SAP HANA environments, and more all sit on top of block volumes. But the connection between “this volume” and “that application” has historically required manual documentation, tagging disciplines that erode over time, or expensive third-party tools.
This lack of visibility has caused slower troubleshooting, overprovisioned resources, and protection gaps that go undetected until it’s too late. Storage teams operate in isolation from the application and consumer teams they serve. This is exactly what the Everpure Enterprise Data Cloud is designed to provide: a unified, intelligent data layer that connects storage telemetry with application context.
Yes, the problem sounds familiar
True, this is not a new problem. Customers have been tackling it for years, and Everpure has solved it for VM infrastructure.
A couple of years ago, Everpure released the Pure1 VM Analytics feature. It was the first major step for VMware customers. By deploying an external OVA collector into a customer’s VMware environment, Pure1 VM Analytics bridged the gap between storage and virtualization. For the first time, storage admins could see the complete I/O path from a VM all the way through to the FlashArray system, combining VMware metrics (CPU, memory, IOPS, and latency) with FlashArray metrics into a single, unified topology. No more coordination across teams just to figure out which VM lives on which datastore, or which datastore maps to which volume. Pure1 VM Analytics made that mapping automatic and visual, turning hours of troubleshooting into a few clicks.
But Pure1 VM Analytics, as powerful as it is, operates at the virtualization layer. It tells you where your VMs live and how they perform. It does not tell you what applications are running inside those VMs, whether those applications are properly protected, or what you should do about it. And it comes with an operational tradeoff: The external collector must be deployed, configured, maintained, and kept connected to each vCenter instance, adding another managed component to the customer’s environment.
Enter, Pure1 application intelligence.
What is Pure 1 application intelligence?
Pure1 application intelligence brings context-awareness to the Pure1 intelligent control plane. It delivers deep, auto-discovered application-level insights that reinvent how IT teams manage their data, not just their storage.
At its core, Pure1 application intelligence answers the questions storage teams have always struggled with:
- What applications are running on my volumes?
- How critical are they?
- Are they properly protected?
- What should I do next?
It does this by collecting new metadata starting with Purity 6.10.0 for FlashArray Block, including application type, size, version, and aggregated file-level statistics such as total size, number of files, number of directories, size distribution, and file extension data. This scan is auto-enabled and runs natively on the array, requiring no additional plugins or infrastructure from the customer. The metadata collected is not sensitive or personal data, and it’s protected with the same enterprise-grade security controls Everpure already has in place.
The application intelligence tab in Pure1 reports which apps are running where, how they consume capacity and file systems, and how well they’re protected across your entire fleet. It includes auto-discovered app identification, file-level analytics, actionable insights, and cross-links into other Pure1 workflows like the Protection Assessment. This reduces troubleshooting time, prevents overprovisioning, and strengthens your security posture.
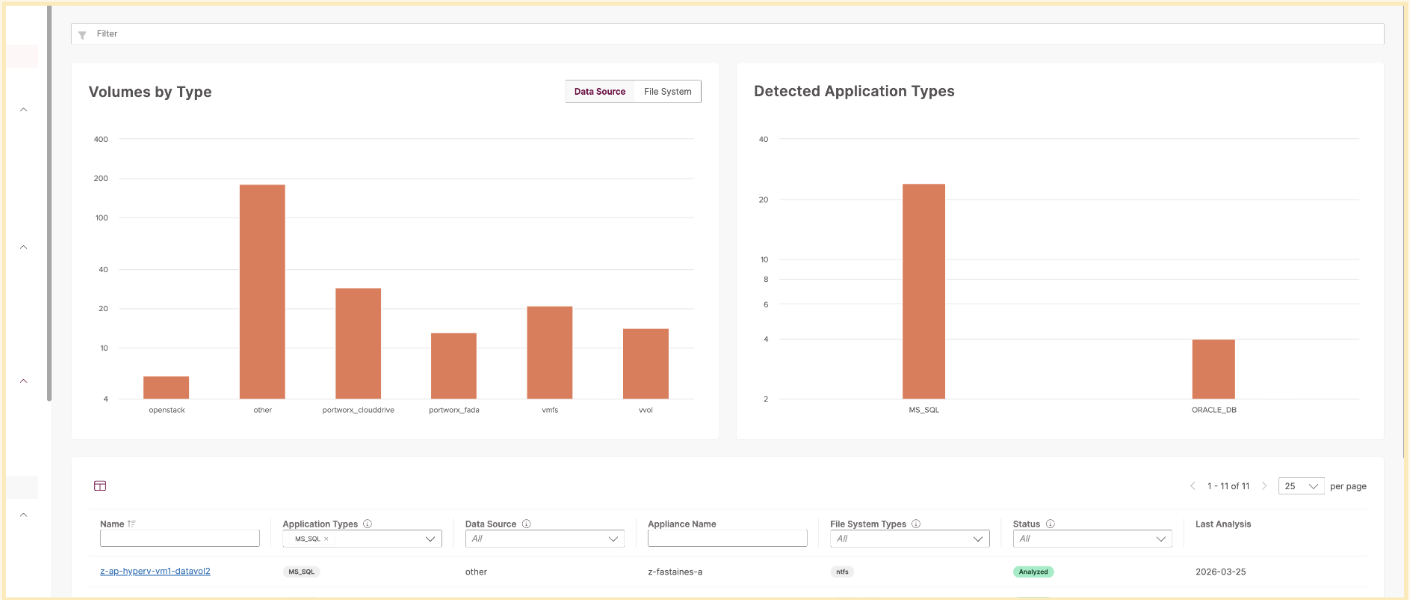
Figure 1: application intelligence dashboard in Pure1.
The transition from storage to data management
It helps to think about the evolution into data management in four stages:
- Data: On the storage level, data can mean a lot of things, but we’ll refer to it as the collection of raw facts.
- Analytics: This stage involves organizing and examining that data.
- Insights: When patterns get discovered, analytics become insights.
- Intelligence: This stage entails applying insights to make decisions and take action.

Figure 2: The four stages of data management.
Pure1 has long excelled at analytics and insights. Pure1 application intelligence is our step into true Intelligence: auto-discovered context, prescriptive recommendations, and, eventually, automated outcomes. Let’s apply these four stages to a couple of examples:
Example #1: Performance optimization
Let’s take a look at an example that might be close to Pure1 users: performance optimization across your fleet.
|
Capability |
What It Looks Like in Practice |
|
|---|---|---|
|
Data |
FlashArray performance analytics pages |
You collect latency metrics from workloads across volumes. The raw numbers are there, but they’re just numbers. |
|
Analytics |
Pure1 performance analytics pages |
Pure1 organizes that data across your fleet, letting you identify which volumes spike during business hours, not just on one array but across all of them. |
|
Insights |
Enriching analytics with application metadata |
Now the picture sharpens. Volume X is not just “busy;” it’s tied to a SQL database and is experiencing latency specifically at peak times. You finally see the why behind the what. |
|
Intelligence |
Fleet compliance policy |
Pure1 application intelligence takes it further: Move Volume X to a higher-performance tier or rebalance workloads across arrays to prevent SLA violations, automatically, before users ever notice. |
This is the journey from raw telemetry to automated outcomes. Each stage builds on the last, and application intelligence is what connects them together into a single, coherent workflow inside Pure1.
Example #2: System-space tag enforcement
Today, storage teams struggle to keep volumes, host groups, and volume groups properly tagged with the applications they serve. Tags decay over time, new volumes get created without labels, and the gap between “what the array knows” and “what the team knows” keeps growing. Application intelligence closes that loop, and here’s how:
|
What Happens |
How It Works |
|
|---|---|---|
|
Data |
Phone home data collection |
FlashArray systems continuously send telemetry (phone home data) to Pure1 AIOps, including I/O patterns, host connectivity, and volume metadata. |
|
Analytics |
Application intelligence engine analysis |
The application intelligence engine analyzes that telemetry at fleet scale, examining workload signatures, I/O profiles, and host-level metadata to build a picture of what is actually running on each volume. |
|
Insights |
Auto-discovered application tags |
The engine identifies application types in system space, for example, recognizing that one set of volumes belongs to an MS SQL cluster and another serves an Oracle database. These are no longer guesses; they’re system-discovered tags like App: MS-SQL and App: ORACLE. |
|
Intelligence |
Automated tag enforcement via workflow orchestration |
Those system-space tags are pushed back down to the FlashArray and enforced as user tags on the actual objects: host groups, volume groups, and individual volumes. This happens through workflow execution using orchestration tools or automation frameworks like MCP, closing the loop without any manual intervention. |
The result is that every volume, host group, and volume group in your fleet is consistently tagged with the application it serves, automatically, and kept up to date as workloads change. No more stale spreadsheets, no more manual tagging disciplines that erode after the first quarter.
What’s ahead
The first release of Pure1 application intelligence focuses on providing auto-application discovery on volumes. Over the upcoming months, Pure1 will evolve the intelligence experience with a few key features, including but not limited to:
- File-level statistics for block volume with data age tracking and data type classification
- Cross Pure1 integration, including AI Copilot support
- VM-level info by adding VMFS VM-level application insight
- Expanding coverage to add insight into volume in ActiveDR™ and ActiveCluster™ configurations
Next steps
- Upgrade to Purity 6.10.x with a Pure1 self-service upgrade
- Go to Pure1 application intelligence (login required)
- Explore the Knowledge page and FAQ
Explore Pure1 Application Intelligence
Get infrastructure visibility like you’ve never had before.