“Energy intelligence” is turning power from cost center into controllable, strategic resource. We know you care about this more than ever, so we’re going to explain how Everpure helps companies achieve energy intelligence by reducing Scope 2 and 3 carbon emissions.
It all starts with the Pure1 Sustainability Assessment, which shows your total energy consumption and savings as well as data center and array-level metrics.
How the assessment works

Figure 1: Pure1 Sustainability Assessment page.
Everpure gives you full transparency into your storage energy consumption and savings. To help you take the lead in energy efficiency, we’ve included a peer rating system that empowers you to set new industry benchmarks.
Pure1’s Sustainability Assessment offers in-depth visibility into your power efficiency compared to your peers, giving you the competitive insights needed to stay ahead. By understanding where you stand and identifying areas for improvement, you can leverage this information to drive innovation and establish your organization as a leader in sustainability.
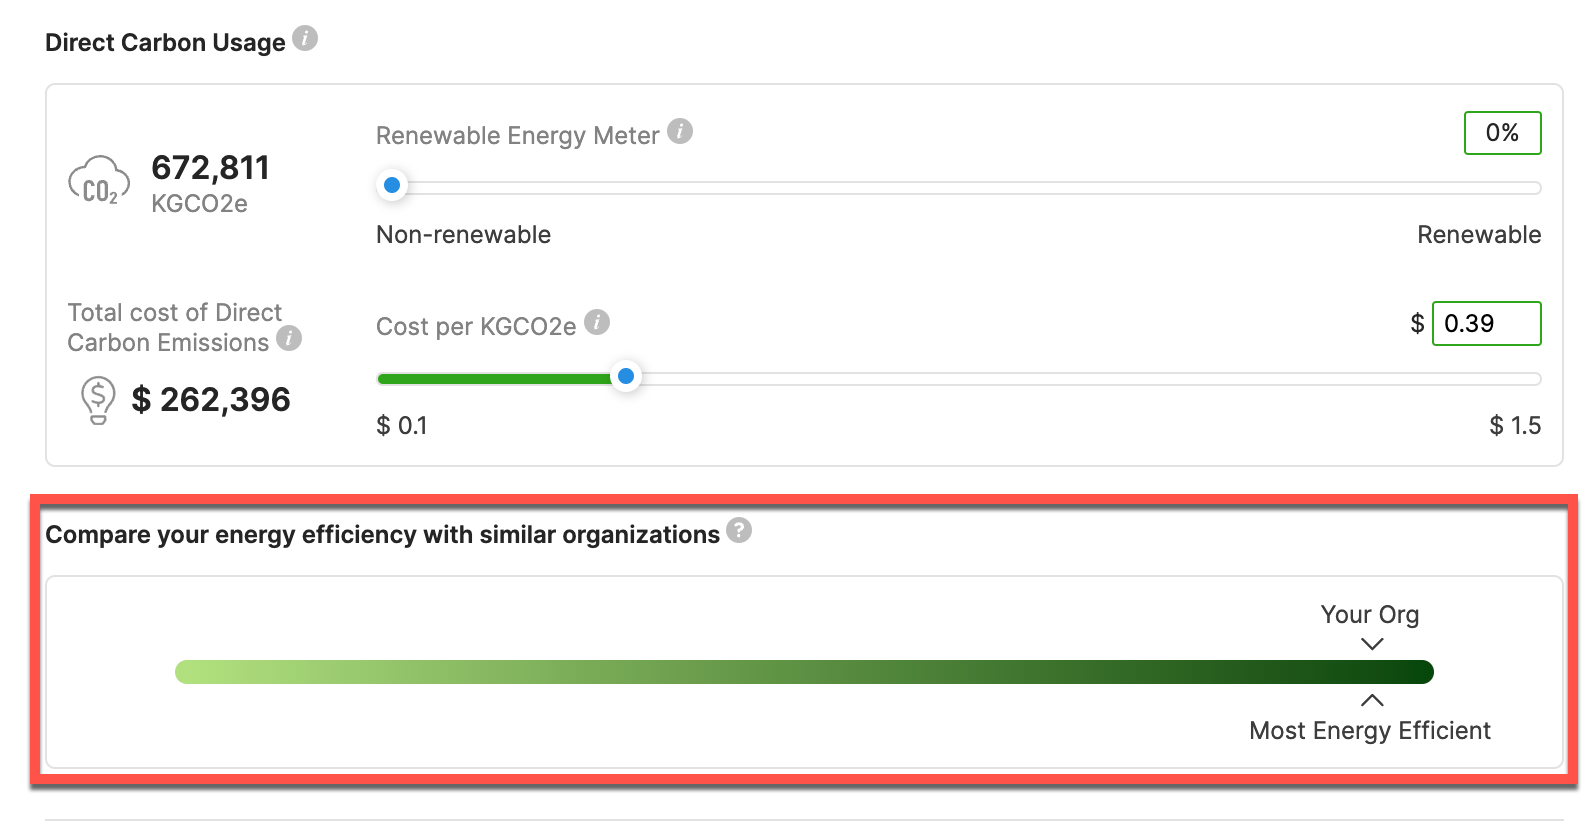
Figure 2: Power usage metrics and comparison to peers on Sustainability Assessment page.
Here’s a closer look at how the rating system works:
Step 1: Data Collection and Clustering
Telemetry data is analyzed along with customer profiles to establish cohorts for similar environments. These are created based on factors such as the fleet size, fleet type, workload, and usage. This clustering process helps identify organizations with similar characteristics, allowing for more accurate comparisons and recommendations.
Step 2: ESG Profile Evaluation
For each cohort, organizations are evaluated on a weekly basis based on their power efficiency profile. The power efficiency profile is based on watts/usable TiB where a weighted average of individual arrays is calculated in the organization in relation to its contributions to the overall usable capacity.
Note that arrays without enough data are excluded from the calculation because we don’t have enough data to calculate a reliable contribution of individual arrays.
Step 3: Identifying Improvement Candidates
If your organization has higher than average power consumption per usable TiB when compared with other organizations that have a similar size, similar usable capacity, and similar average load, you’re rated as a candidate that “can improve.” These organizations are further identified for potential recommendations to help improve their ESG profile.
Step 4: ESG Recommendations
Specific insights and related proactive recommendations are available to help organizations improve their ESG profile. These recommendations may include:
- Upgrading or replacing end-of-life (EOL) components with more energy-efficient components
- Upgrading to newer shelves or data packs (e.g., from 6G or 12G shelves to NVMe)
- Consolidating workloads and optimizing for lower power usage
- Using larger data packs (DirectFlash® Modules) to potentially reduce the need for an extra shelf
- Enhancing the usage of your array for higher capacity (and/or performance)
A few items to note:
- If a customer is newly onboarded, there needs to be about four to six weeks of telemetry data before a cohort is assigned to the new customer for ESG profile evaluation.
- Customers may be reassigned to a new cohort if a significant change in the fleet profile is determined.
- Telemetry data is mandatory to keep the information up to date. The customer may not get comparative data if no array is sending telemetry data within the fleet.
- The arrays without enough data may be excluded from the calculation if the reliable contribution cannot be calculated for the individual array.
But it doesn’t end there. Our new peer rating system serves as your sustainability compass, providing clear insights into how your efforts measure up against similar organizations.
It’s more than a benchmark; it’s a community of progress, inspiring you to unlock new levels of efficiency and environmental stewardship.
Expanding Your ESG Strategy with Scope 3 Insights
In addition to the energy efficiency and peer comparisons provided by Pure1, you’ll also get comprehensive Scope 3 emissions data. These insights cover the entire lifecycle of your Everpure arrays, from the production and transportation of materials to assembly, use, and eventual disposal. This expanded view allows you to understand and reduce the indirect environmental impact of your storage infrastructure, offering a more complete ESG profile. By factoring in Scope 3 emissions, you can take a proactive approach to sustainability, aligning with corporate responsibility goals and regulatory requirements while further enhancing your organization’s environmental standing.

Figure 3: Scope 3 emissions across the lifetime of your storage fleet.
Curious about where you stand? Take the lead in building a sustainable future. Log in to Pure1 and start setting the pace for responsible, impactful carbon management across your industry. The future is efficient, and with Everpure, it’s brighter than ever. Join us in making a difference, one watt at a time.

Prioritizing energy intelligence for sustainable growth
Download the MIT Technology Review & Everpure
report on why energy intelligence is becoming
a critical business metric in the AI era.

AI’s Power Problem
AI’s insatiable energy appetite is wreaking havoc. These are our suggestions.